The dashboard end of the stack

A real addaNet screen rather than a mock-up: a water-quality device on a demonstration line at our Johannesburg base, with live values, three-hour trends and the raw record table — the same layout a production line, a borehole or a generator site gets, with its own parameters.
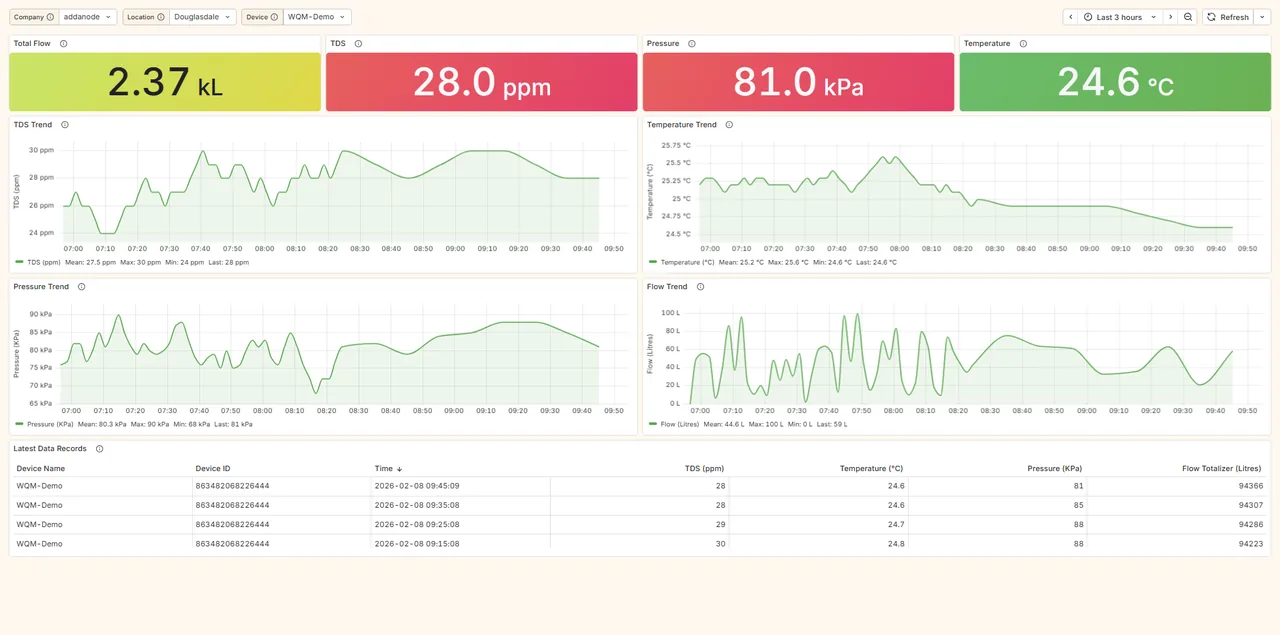
addaNet dashboard for a water quality monitoring device: total flow 2.37 kL, TDS 28 ppm, pressure 81 kPa, temperature 24.6 °C, with three-hour TDS, temperature, pressure and flow trends and the latest data records
addaNet water-quality dashboard on a demonstration line at our Douglasdale office: live TDS, flow, pressure and temperature, three-hour trends, and the record table behind them.